Alexandra Hills in Redland City – Image: Google Earth
When setting general rates to apply from July this year, Redland City Council will be using new land valuations published recently by the State Government’s Valuer-General.
Over the two years since the Valuer-General last examined Redland City, the median value of residential land increased by 36%, from $375,000 to $510,000.
The median value is the value in the middle. If 100% of the individual properties in an area are sorted from lowest valuation to highest valuation, the median value is the one that has 50% of properties worth less and 50% of properties worth more.
The median is different to the mean value which is the total of all values divided by the number of properties. Mean values can be unduly influenced by a small number of very high value properties so median values are commonly used in property market analysis.
Valuations by suburb
The Valuer General publishes a median residential land value for each suburb including the islands, provided that they have a minimum of 50 residential land use properties.
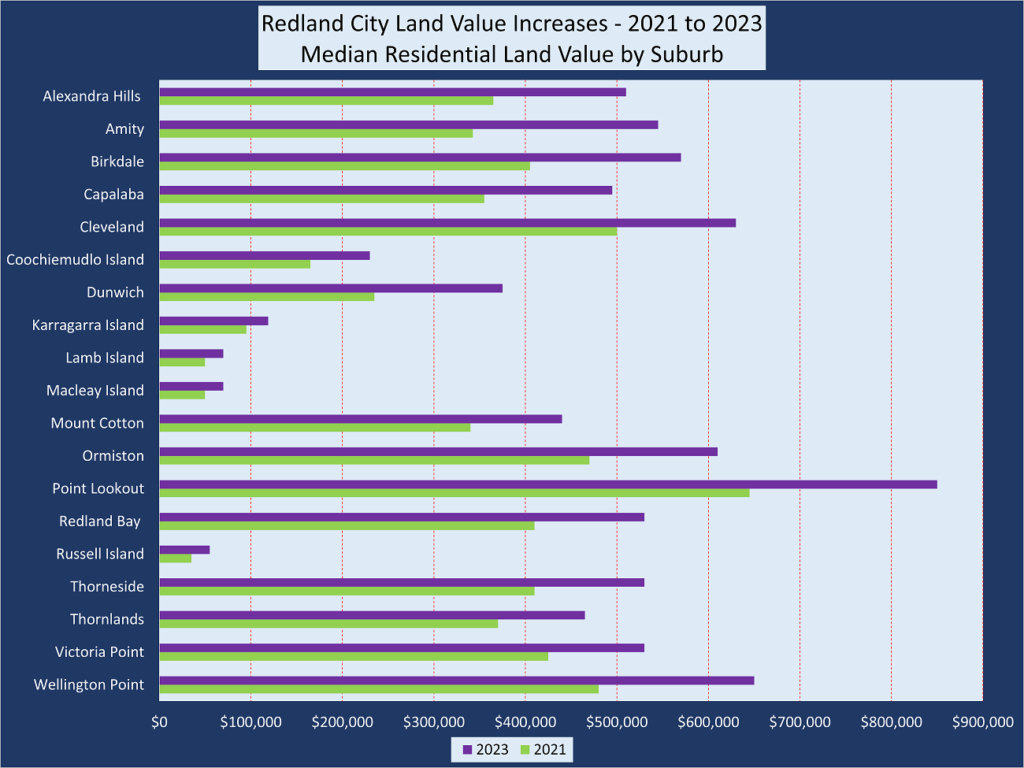
The first chart shows how land values have increased for each Redlands suburb from October 2021 to October 2023.
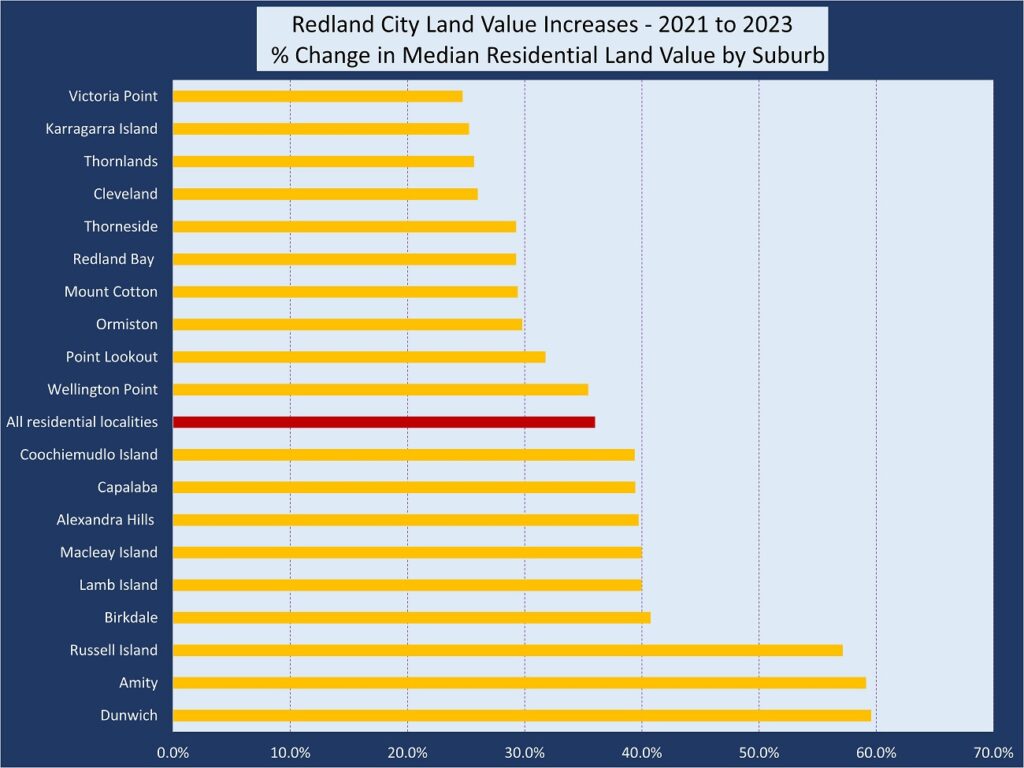
The second chart shows the percentage increases in each suburb’s median value – from lowest to highest – with the city-wide figure in the middle.
This shows that the suburbs which have experienced the higher increases in median value are Dunwich, Amity and Russell Island.
Impact on general rates
Changes in property valuations may affect the amount of general rates imposed by Redland City Council.
If the percentage increase in your land value is greater than the city average then this may result in your rates bill increasing more than the rates bill of a property owner whose land value percentage increase is lower than the city average.
But there are other factors which will impact on a property’s general rates, such as the thresholds for minimum rates.
Objecting to land valuations
A letter from the State Government will be sent to each property owner advising their property valuation. Objections to valuations can be made up to 27 May 2024.
You can find out your property value on line.
| Residential locality | Number of Residential Properties | 2021 Median Property Value | 2023 Median Property Value | % Change in Median Property Value |
| Alexandra Hills | 5,658 | $365,000 | $510,000 | 39.7% |
| Amity | 344 | $342,500 | $545,000 | 59.1% |
| Birkdale | 4,617 | $405,000 | $570,000 | 40.7% |
| Capalaba | 4,466 | $355,000 | $495,000 | 39.4% |
| Cleveland | 4,444 | $500,000 | $630,000 | 26% |
| Coochiemudlo Island | 667 | $165,000 | $230,000 | 39.4% |
| Dunwich | 388 | $235,000 | $375,000 | 59.6% |
| Karragarra Island | 204 | $95,000 | $119,000 | 25.3% |
| Lamb Island | 623 | $50,000 | $70,000 | 40% |
| Macleay Island | 3,253 | $50,000 | $70,000 | 40% |
| Mount Cotton | 2,063 | $340,000 | $440,000 | 29.4% |
| Ormiston | 1,950 | $470,000 | $610,000 | 29.8% |
| Point Lookout | 714 | $645,000 | $850,000 | 31.8% |
| Redland Bay | 5,910 | $410,000 | $530,000 | 29.3% |
| Russell Island | 6,524 | $35,000 | $55,000 | 57.1% |
| Thorneside | 1,018 | $410,000 | $530,000 | 29.3% |
| Thornlands | 5,573 | $370,000 | $465,000 | 25.7% |
| Victoria Point | 4,984 | $425,000 | $530,000 | 24.7% |
| Wellington Point | 4,294 | $480,000 | $650,000 | 35.4% |
| All Redland City residential localities | 56,181 | $375,000 | $510,000 | 36.0% |
This data is taken from the Valuer-General’s Redland City LGA valuation overview.
Sheldon is not included, presumably because it does not meet the minimum of 50 residential properties threshold.
Previous changes in land valuations
Here are links to previous stories by Redlands2030 about changes to land valuations.
Redlands2030 – 31 March 2024
Please note: Offensive or off-topic comments will be deleted. If offended by any published comment please email thereporter@redlands2030.net