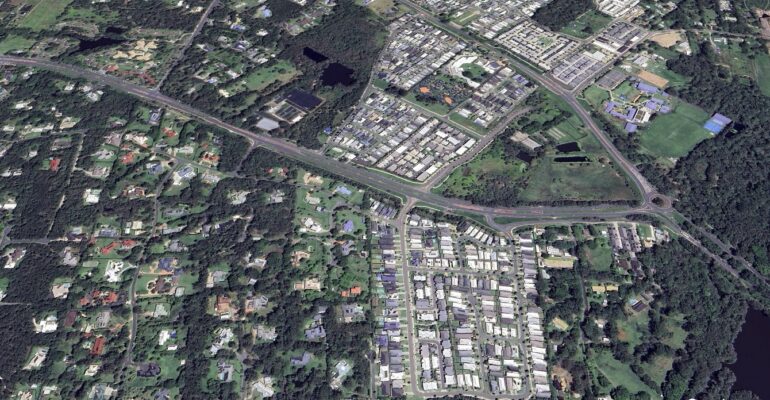
Thornlands in Redland City – Image: Google Earth
Figures released recently by the Australian Bureau of Statistics (ABS) show that Redland City’s population increased by 3,080 people or 1.9% during the 2022/23 financial year.
The estimated resident population of Redland City was 166,809 as at 30 June 2023.
Redland City’s population growth during 2022/23 was well above the city’s average annual population growth of 1.2% over the past decade.
In 2022/23 nearly all of the increase in Redland City’s population was caused by immigration, with Net Overseas Migration predominant.
| Redland City Population Increase during 2022/23 | ||
| Natural increase | 123 | |
| Net Internal Migration | 1,259 | |
| Net Overseas Migration | 1,698 | |
| Total | 3,080 |
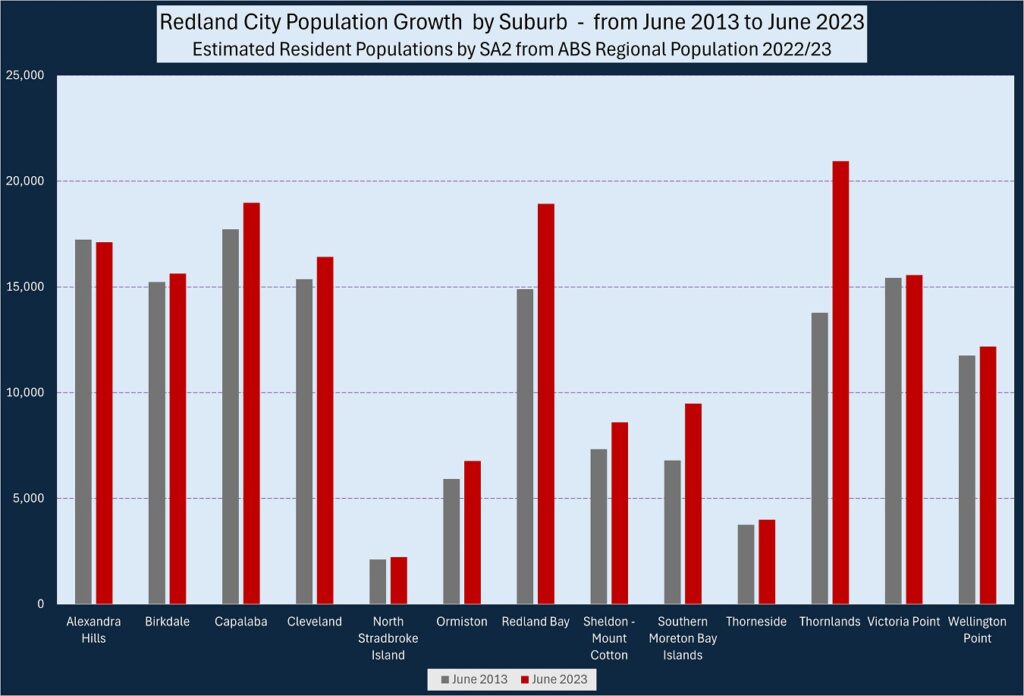
Suburb by suburb comparison
The ABS provides details of population by small areas which they call Statistical Area level 2 (SA2). These SA2 categories are similar to suburbs.
Using the ABS SA2 figures we can see where Redland City’s’ population is growing.
| 2021/22 | 2022/23 | Increase | % change | |
| Alexandra Hills | 16,861 | 17,108 | 247 | 1.5% |
| Birkdale | 15,521 | 15,628 | 107 | 0.7% |
| Capalaba | 18,674 | 18,976 | 302 | 1.6% |
| Cleveland | 16,151 | 16,417 | 266 | 1.6% |
| North Stradbroke Island | 2,217 | 2,228 | 11 | 0.5% |
| Ormiston | 6,606 | 6,768 | 162 | 2.5% |
| Redland Bay | 18,519 | 18,931 | 412 | 2.2% |
| Sheldon – Mount Cotton | 8,535 | 8,593 | 58 | 0.7% |
| Southern Moreton Bay Islands | 9,063 | 9,486 | 423 | 4.7% |
| Thorneside | 3,941 | 3,991 | 50 | 1.3% |
| Thornlands | 20,255 | 20,940 | 685 | 3.4% |
| Victoria Point | 15,356 | 15,563 | 207 | 1.3% |
| Wellington Point | 12,030 | 12,180 | 150 | 1.6% |
| Redland City total | 163,729 | 166,809 | 3,080 | 1.9% |
Most population growth has occurred in Thornlands, Redland Bay and the Southern Moreton Bay Islands, areas which are not particularly well served with public transport infrastructure.
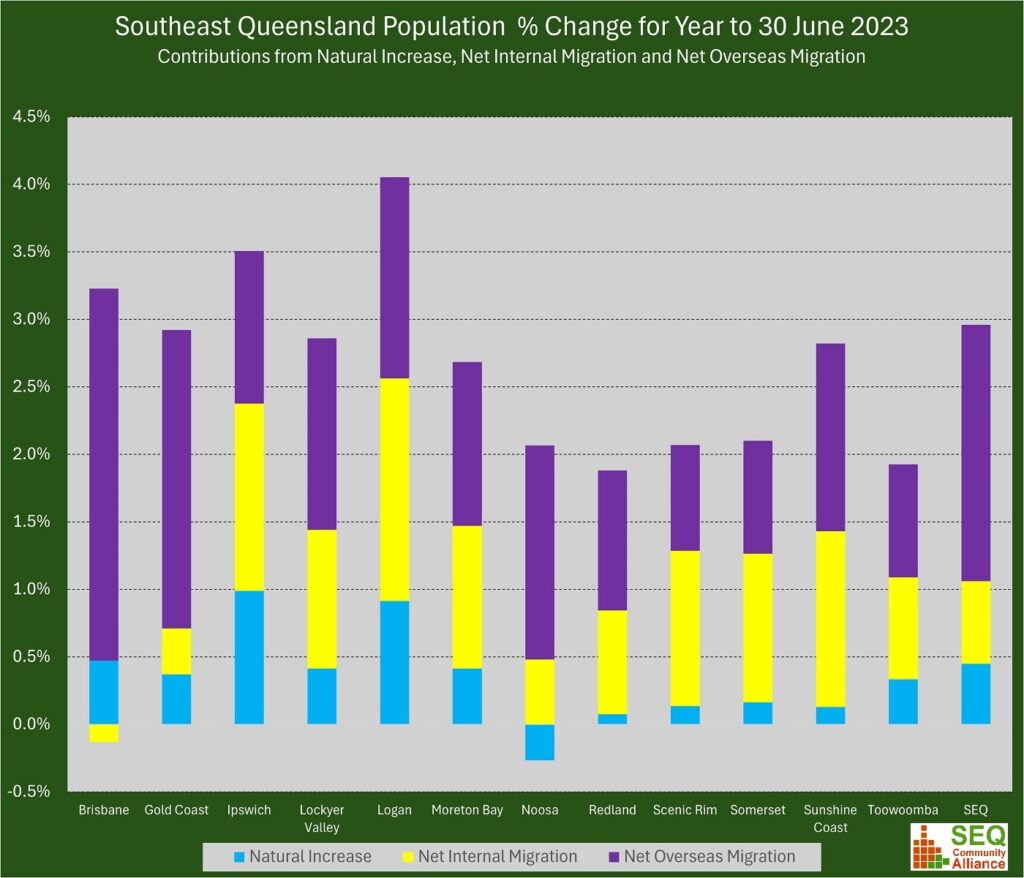
SEQ comparisons
Redland City’s 1.9% population growth during 2022/23 was relatively modest compared with the 3.0% population growth sustained by the whole southeast Queensland region.
The impact of internal and overseas migration on all SEQ local government areas is shown in the chart below.
Redland Housing Strategy
The State Government will soon be issuing its final Redland Housing Strategy together with a demand that Redlands City amend its City Plan to achieve increased population density, especially in areas well served with transport and other infrastructure.
This could lead to a shift from urban sprawl in the southern half of Redlands, to more townhouses and apartments in the northern suburbs, especially in areas close to the Cleveland Train Line.
Redlands2030 – 7 April 2024
Please note: Offensive or off-topic comments will be deleted. If offended by any published comment please email thereporter@redlands2030.net
One Comment
With reference to the SMB Islands being the largest growth area and infrastructure. According to a Health official working on Doctor numbers per population, Macleay Island (contrary to sensus results) is now just under 6,000 people. Two more permanent Drs are required apparently, but so is public transport, footpaths, sealed roads, green bins, roundabouts, sewerage system…. basics.
We love our small community, but for years Council charging us higher rates than the mainland for less services will hopefully be addressed by the new Council.