
The specific impacts of climate change on our local area and therefore directly on our lives is often hard to quantify. To make matters worse, people often confuse weather and climate.
You will often hear people say that the weather has always varied and that we have seen similar weather events in the past. Such statements are meant to imply that the climate is not changing. The reality is very different as successive Intergovernmental Panel on Climate Change reports and Bureau of Meteorology (BOM) data show. My local data supports the general trend shown in BOM data – that there is a decline in annual rainfall along the east coast. In particular, my rainfall records show that the main reduction is occurring in the first half of the year, particularly February to May.
To determine this, I examined the change in rainfall data I have collected at our home in Burnett Street, Wellington Point, over the past 15 years, with records from Bureau of Meteorology Ormiston & Redlands weather stations nearby, both of which have more than 100 years of data, and with Capalaba and Redlands station for the past 15 years. I have used a typical Bunnings purchased rain gauge which of course is not quite as accurate as the BOM rain gauges. And I read the rain gauge each morning at around 8am. BOM does it at 9am. As I am only examining monthly and annual average data, this difference doesn’t matter.
However, I will start by clarifying the terms weather and climate. Then I will examine what may be a change in the climate of the Redlands that many gardeners may have already observed, but not necessarily quantified – changes in our rainfall quantity and patterns. The Bureau of Meteorology says that “the weather of any place refers to the atmospheric variables for a brief period of time” typically over the next few days. We normally see this displayed as some combination of maximum and minimum temperatures, rainfall, humidity and wind speeds. “Climate, however, represents the atmospheric conditions for a long period of time, and generally refers to the normal or mean course of the weather. Climate can now be expanded to include the future expectation of long term weather, in the order of weeks, months or years ahead.” Climatic analysis involves complex modelling of the atmosphere, often using super computers, and detailed statistical analysis of long term weather data and trends.
Climate change trends at Burnett St. Wellington Point
So what trends does my rainfall data indicate? Figure 1 shows the annual rainfall since 2004 when we installed the first of two 9000 litre rain water tanks. These have provided about 50 percent of our water supply to the house and extensive gardens.
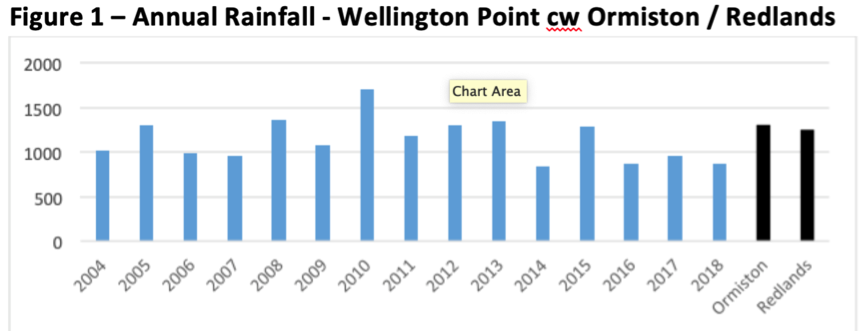
From the data, we find that the average rainfall for Burnett Street compared with Ormiston and Redlands BOM sites is:
| Burnett St Wello Pt. 15 yr Average | 1136 | mm/yr | ||
| Long Term Average Redlands >100yrs | 1252 | mm/yr | ||
| Long Term Average Ormiston >100yrs | 1306 | mm/yr |
Figure 1 shows that the annual rainfall is highly variable, ranging from 840 to 1703mm, that’s about a 100 percent change. This large variation is a feature of the Australian climate, which historically has had a higher variability from year to year than many other parts of the world. Figure 1 shows the extent of the effect of the current Queensland drought with 4 out of the last 6 years receiving well below average rainfall.
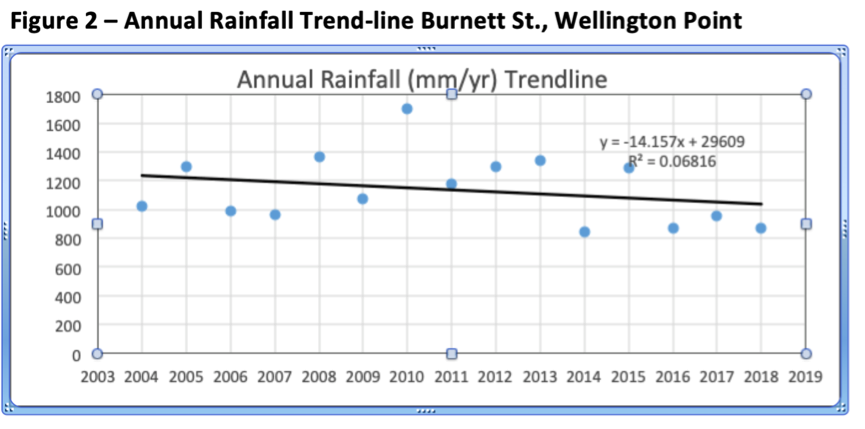
Figure 2 shows the trend from 2004 to 2018 as a reduction of annual rainfall of about 142mm per 10 years at Burnett St., Wellington Point. This trend-line is more than twice the decline rate of the Bureau of Meteorology (BOM) decadal decline trend for South East Queensland of between 40 to 60mm per 10 years from 1970 to 2017 (See figure 3). Trend lines need to be interpreted with care as data over 30 years is preferred and factors such as the start and end dates chosen can affect the trend line. For example, figure 2 could be interpreted as increasing rainfall from 2004 to 2010, and then a decrease since 2010.
Information about interpreting rainfall trends is available on this Bureau of Meteorology webpage.
The BOM decadal decline rate for rainfall (figure 3) also shows a clear reduction in rainfall around all the east and south east coast and in particular, around major cities and their catchment areas. This may in part be due to the heat island effect in cities as vegetation is replaced by more housing, commercial areas, carparks and roads. These hard surfaces absorb and store more solar radiation, and with fewer plants to cool the air via transpiration, air temperatures increase. This has significant consequences as population increase tends to be around cities, increasing water demand while limiting further water catchment and storage areas close to these major population centres. It also makes our cities and suburbs hotter, requiring more energy to cool homes and businesses.
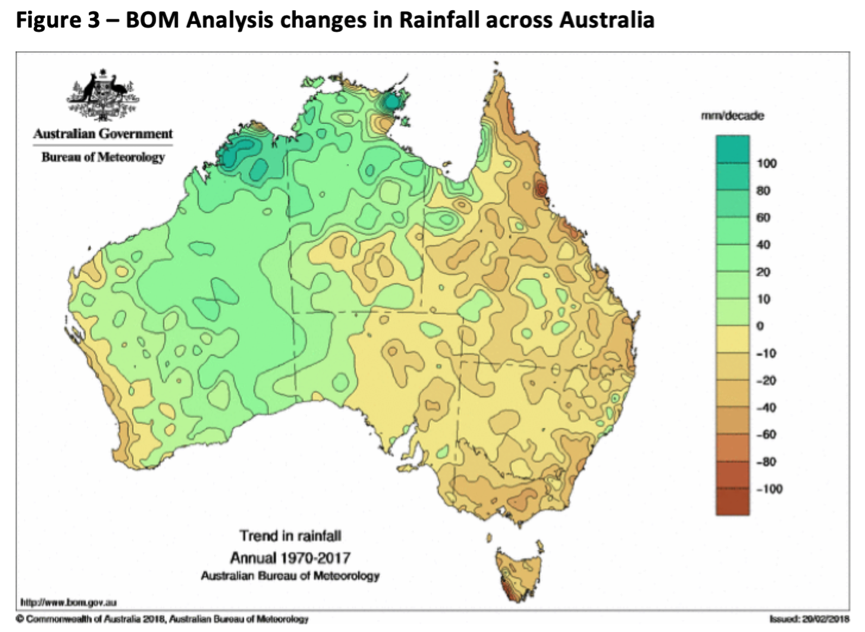
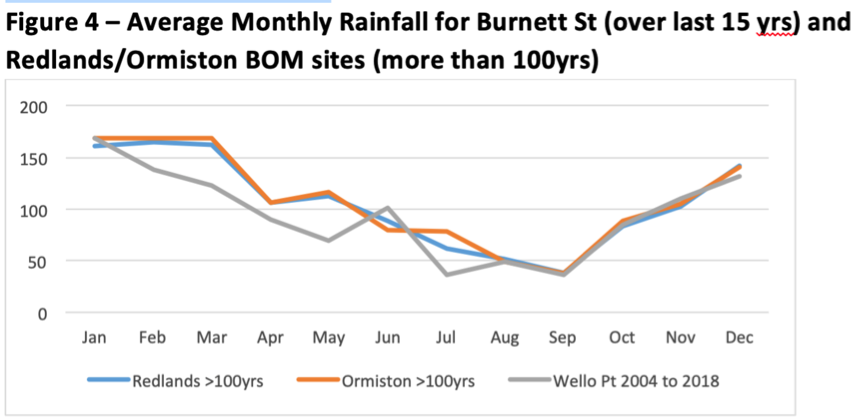
Figure 4 shows the monthly average rainfall comparing long term data from Ormiston (orange line) and Redlands (blue line) with 15 years of data from Wellington Point (grey line). Long term records for Ormiston and Redlands show that the first 3 months are normally our wet season. However, we see a clear trend of reduced rainfall from February to May at Wellington Point, with higher than average rainfall occurring in June.
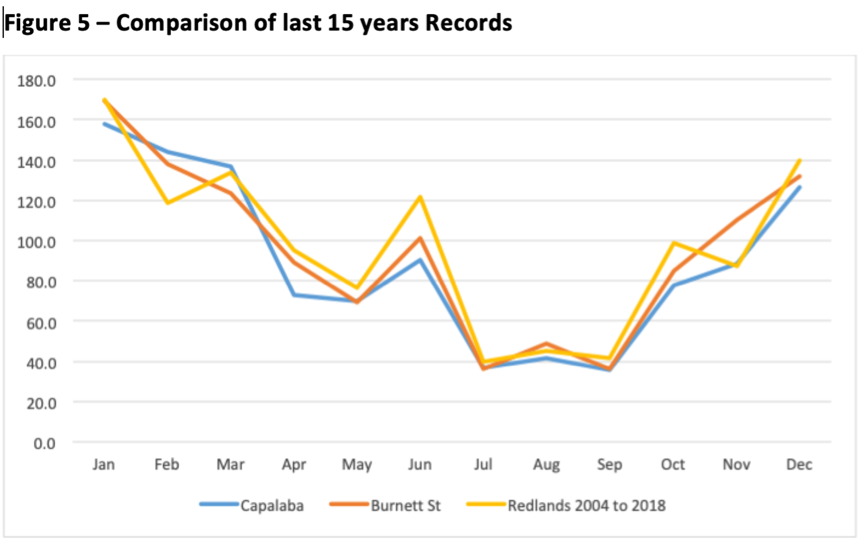
I also checked to see if the last 15 years of records at Redlands and Capalaba showed a decrease in rainfall from February to May, and an increase in June. Figure 5 shows the results and a similar trend can be seen. It should be noted that there is more missing data from the BOM Redlands site than the other two sites, and this causes more variation in the Redlands data. Note that the Redlands site was shifted about one kilometre in 2013. A marine scientist friend living on North Stradbroke Island has analysed similar BOM data from Cape Moreton, Point Lookout and Coolangatta and found similar trends.
Discussion
So what can we make from this information? The data agrees with the BOM rainfall trend map and shows that our annual rainfall is continuing to decrease, at a more rapid rate in recent years than longer term BOM data. It also shows that the majority of this decrease is from lower than usual rainfall in our traditional wet season, particularly February and March, but right through to May. This trend could be short term and associated with the millennial drought, or it could be a longer term trend associated with climate change.
The trend of decreasing annual rainfall across eastern and south eastern Australia, which includes SEQ, is consistent to some extent with climate change predictions, where clear reductions in rainfall are occurring in the south-east (Victoria and Tasmania) and south-west WA, as weather frontal systems that move from west to east across southern Australia are pushed further south. Here’s a part summary for the BOM’s Annual Climate Statement 2018:
- Nationally-averaged rainfall 11% below average for the year at 412.8 mm (1961–1990 average 465.2 mm)
- Rainfall below average for very large areas, affecting central and southern Queensland, New South Wales, Victoria, eastern South Australia, and the South West Land Division in Western Australia
However, there are complicating factors, particularly for areas such as SEQ which are affected by tropical weather systems as well, including cyclones and monsoon troughs. Annual rainfall globally is increasing, including in Australia, as the warming atmosphere and oceans put more moisture into the atmosphere, but this increase is not spread evenly. Figure 3 shows that rainfall is increasing mostly in the north-west and north. Rainfall intensity increasing, leading to more erosion and flash flooding. But in areas with decreasing rainfall, evaporation rates and run-off are decreasing. This is in turn reduces catchment of water in dams and reservoirs.
The BOM also produces annual State of the Climate reports and these are sober reading.
So what are the consequences for the Redlands? Understanding the changes in rainfall patterns and totals helps us to manage our water use better. However, while the Redlands water supply is now interconnected with the Brisbane water supply, rainfall across the SEQ catchment area is decreasing while population and demand are increasing. Any discussion with politicians regarding sustainability limits, including population limits, is unmentionable. So no population cap proposals ever see the light of day. Desalination is often given as the ultimate solution but this can have high local environmental impacts, is costly and energy intensive.
For water dependent businesses, or local gardeners and farmers, these rainfall pattern changes are very concerning as they could lead to a reduction in productivity and increased costs, unless improvements in water use efficiency are constantly made to offset the deficit. For our home specifically, it means that our 18,000 litres of rain water storage is used up more quickly as our gardens, including 7 fruit trees and vegetable patches, currently require 300 litres of water per day on average, and much more in spring and summer.
Written by: Trevor Berrill, Sustainable Energy Systems Consultant, Wellington Point
Editor: Contributions by citizens journalists that help to inform readers on issues relevant to our community are welcomed by Redlands2030.
Previous articles by Trevor Berrill published on this website:
Redlands2030 – 9 May 2019
Please note: Offensive or off-topic comments will be deleted. If offended by any published comment please email thereporter@redlands2030.net
4 Comments
That is an excellently compiled report which makes it pretty clear that climate change is upon us, but I don’t think acknowledgment of this by the vast majority is an issue, IMO the issue revolves around what effect humans are having on the planets climate.
Just being the devils advocate, and maybe I’m looking in the wrong areas, but there is a dearth of eminent people in the field of climate change who appear in the general media to present their views and evidence. Mostly, we only see and hear from Politicians, media and activists on this subject, who seemingly expect total adherence without proper explanation.
I do remember a Q & A program on the ABC where world famous physicist Dr Brian Cox was on the panel, along with a notable climate change denier who asked Cox to present any evidence which supported the theory that man was a major contributor to global warming. Amazingly, apart from a deriding quip aimed at this person, the only evidence Cox could convey to the thousands of eager television viewers was to wave a piece of graph paper. No doubt it proved what we already know, the planet is warming and weather patterns have altered.
The issue of mans contribution to climate change is so huge, you would think media organisations would constantly encourage the appearance of any number of eminent and respected climate scientists to appear on their programs, seemingly not so, as they sometimes prefer the sensationalist route by having us listen to the ravings of young school aged activists and others.
Some twenty or so years ago there was a massive volcanic eruption in Peru I think it was, international airlines were suspended in that region of the planet for a number of days as the ash cloud settled. I vividly remember the news broadcasts at the time, almost gleefully reporting that scientists predicted this eruption had spewed more greenhouse gas into the atmosphere than man had done since the beginning of the industrial revolution.
Since that time there have been a number of similar sized eruptions as well as dozens on a smaller scale around the planet, Iceland being a more notable occurrence, and interestingly, perusal of the Smithsonian Institute site gives a sobering view of our planets volcanic activity and history dating back 10,000 years. https://volcano.si.edu/
This has been a huge impasse for me when trying to sort the wheat from the chaff in the climate debate, obviously due to the direct evidence given and things said by scientists about volcanic activity, as well as other natural causes like rotting forests and vegetation, gaseous emissions unlocked from silt beds in the oceans and other forms of methane just to name a few.
My predicament is also due to the apparent unpreparedness of the media to encourage our most eminent climate scientists to lay bare their theories on mans contribution.
Yes, the planet is warming. Is the level of mans contribution just a theory without proper explanation?
Does it matter really?
We’re all going to melt in 12 years time according to all the “experts” and school kids so I’m getting out of the bloody Redlands damn fast!
Tassy seems a fair bet – sure don’t want to melt!
Yes, Tassy sounds like a good bet, I’ve often threatened to kiss the humidity good bye and go there myself, but realising what a great part of the world I live in sanity has prevailed.
But yeah, I think it does matter, simply because mans contribution to climate change is one of the main drivers of proposed policy in the current election, and it’s extremely important that people are able to base their thinking on fact.
Hi Ray – Climate change (more correctly called global warming) is not theory. It is established fact and the main contribution is from humans burning fossil fuels. Please read the Intergovernmental Panel on Climate Change reports available here https://www.ipcc.ch/ The contribution of volcanoes to global warming has been researched and is a very minor contribution to overall warming. In fact the initial eruptions above ground cause a cooling effect due to dust particles reflecting sunlight back to space. If the IPCC reports are too hard going for you, please read the following sites that dispel the misinformation provided by the fossil fuel industry. http://www.realclimate.org/index.php/archives/2004/12/about/
and https://skepticalscience.com/ Both these web sites provide accurate analysis and information for the public. There’s much media covering the science accurately but if you rely mostly on the Murdoch press or Fox (they are linked) then you will mainly get the deniers’ view. Finally, good on the school children for protesting – they have read the science and made up their own minds that this is a truly and existential threat and they are the ones mostly likely to bear the brunt of the crisis.