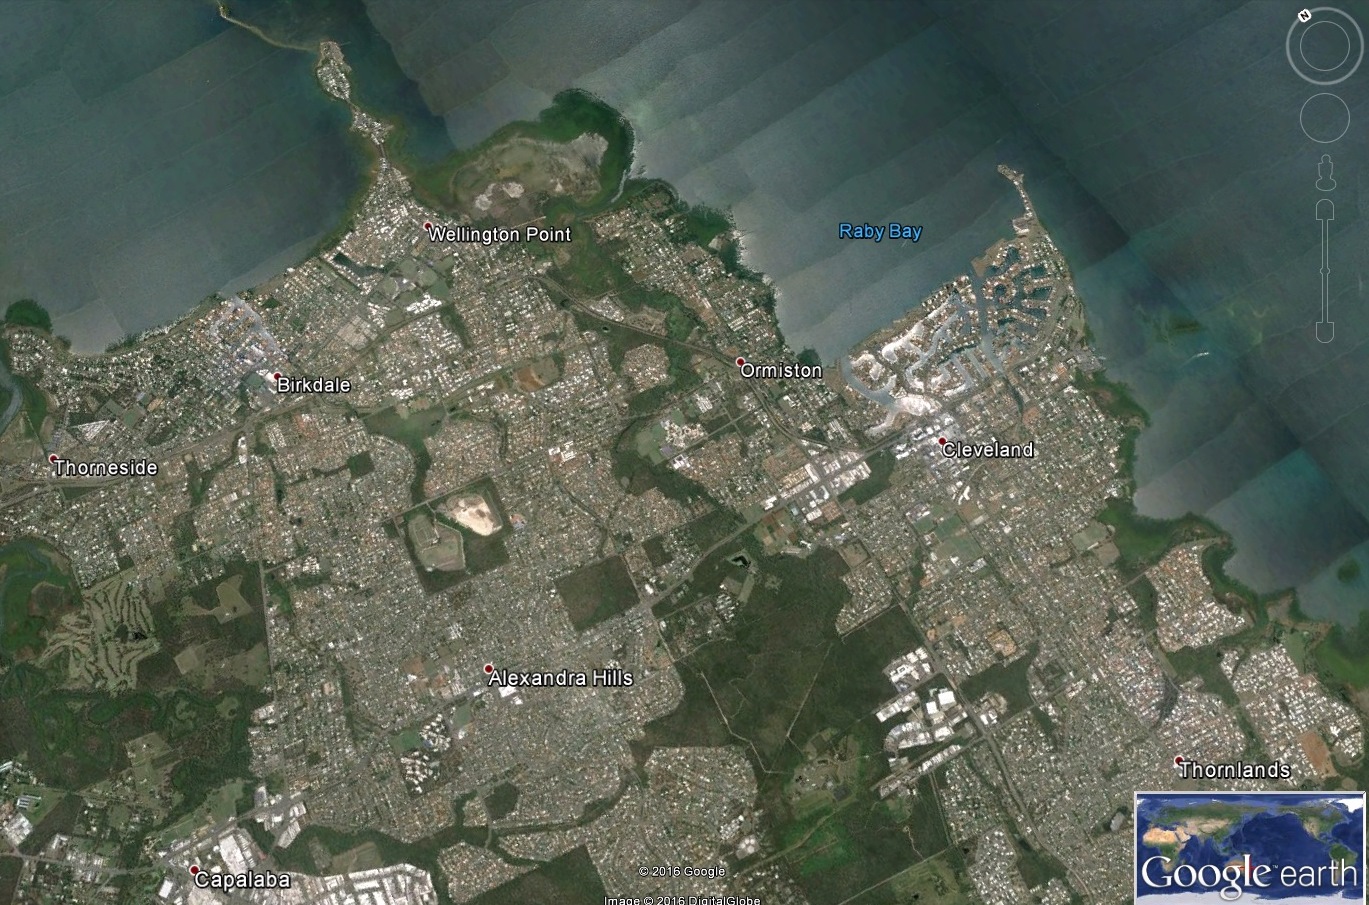
Above average increases in land valuations were posted for some of Redland City’s northern suburbs
Recently announced land valuation changes have provoked concerns from some Redlands property owners that this may lead to increases in their Council rates.
The Bulletin reported recently that Wellington Point and Ormiston land valuations increased by more than 20% compared with a 14.6% city wide increase in residential land values.
Two days later, Redland City Council issued a news release saying that an increase in property valuations doesn’t necessarily mean an increase in rates. Chief Executive Officer Bill Lyon said Council had been contacted by residents following the recent release of new property valuations by the State Government.
He said an increase in land values did not automatically mean an increase in rates and “Council determine rates at Budget time based on the cost of providing services to the community and we work hard to keep rates increases as low as possible.”
Areas with above average increases in median land valuations over the last 12 months were:
- Wellington Point 21.4%
- Ormiston 20.3%
- Birkdale 16.7%
- Capalaba 15.8%
- Victoria Point 15.8%
- Redland Bay 15.5%
- Thornlands 15.1%
12 months ago some of the City’s islands experienced significant falls in median land valuations but this time the Valuer-General’s report showed no changes for the southern Moreton Bay islands and towns on North Stadbroke Island.
Valuer-General Neil Bray said the latest valuations would take effect on 30 June 2016 and landowners who believed their latest (2016) valuation was incorrect, and could provide information to support this, could lodge their objection online at www.dnrm.qld.gov.au or at the address shown at the top of their valuation notice by 3 May 2016.
Valuation changes over the past three years
The latest valuation changes, for the period October 2014 to October 2015, look a bit ‘lumpy’ but a more consistent pattern can be seen if changes are viewed over a longer time period. Changes for the two year period October 2012 to October 2014 were published in March 2015.
The changes for these two periods, separately and aggregated, are shown in the table below together with the latest median land values for most residential localities in Redland City.
| Residential locality | % change 2012-14 |
% change 2014-15 |
2015 $value |
% change 2012-15 |
| Alexandra Hills | 0 | 14.6% | $235,000 | 14.6% |
| Amity | 0 | 0 | $265,000 | * |
| Birkdale | 3.9% | 16.7% | $315,000 | 21.2% |
| Capalaba | 5.6% | 15.8% | $275,000 | 22.2% |
| Cleveland | 14.0% | 9.4% | $350,000 | 22.8% |
| Coochiemudlo Island | -15.3% | 9.9% | $122,000 | -6.9% |
| Dunwich | 0 | 0 | $195,000 | 0.0% |
| Karragarra Island | -13.7% | 0 | $60,000 | * |
| Lamb Island | 0 | 0 | $32,000 | 0 |
| Macleay Island | -15.2% | 0 | $26,000 | * |
| Mount Cotton | 0 | 10.6% | $235,000 | 10.6% |
| Ormiston | 0 | 20.3% | $355,000 | 20.3% |
| Point Lookout | 0 | 0 | $435,000 | * |
| Redland Bay | 0 | 15.5% | $280,000 | 15.5% |
| Russell Island | -15.1% | 0 | $17,400 | -15.1% |
| Sheldon | 0 | 0 | $242,000 | * |
| Thorneside | 5.7% | 10.7% | $310,000 | 17.0% |
| Thornlands | 1.9% | 15.1% | $305,000 | * |
| Victoria Point | 0 | 15.8% | $275,000 | 15.8% |
| Wellington Point | 1.8% | 21.4% | $340,000 | 23.6% |
| All residential localities | 4.4% | 14.6% | $275,000 | 19.6% |
Median values and percentage changes for 2012-14 and 2014-15 are sourced from these Valuer-General reports:
Percentage changes for the three year period 2012-15 are calculated from this data.
* In six residential localities the Valuer-General has made slight adjustments to the 2014 median values between the 2015 and the 2016 reports. To avoid possible confusion, no calculated three year change is shown for these residential localities.
Redlands2030 – 12 March 2016
Please note: Offensive or off-topic comments will be deleted. If offended by any published comment please email thereporter@redlands2030.net
Valuation on my property increases with regularity but can’t see why as quality of life is deteriorating living adjacent to Finucane Rd Capalaba where noise and air pollution during a.m. & p.m. rush hour is deafening, and can’t hope to get even close to $400,000 were I to sell my property. Back neighbour on Finucane Rd added extension to where I no longer had privacy (in-fill development that robs many people of privacy). To erect a fence within my boundary (neighbour refused to share cost) high enough to privatise my back yard entertainment area was an expense I could ill afford struggling to get by as a pensioner. Councils determine rate increases according to site valuations I’m told.
This issue pops up every year when new valuations come out. Rates are determined based on the valuation and the rate in the dollar. Councils vary the rate from year to year as a result the impact of higher valuation is partially or even fully offset the increase resulting from the valuation. Sure it does give an opportunity for Councils to gain from increased rates, but in the main they tend to be kept reasonable in line with inflationary increases, even Redlands!
We are all ready paying for the second highest rates in Southeast second behind Gold Coast
Imagine my shock when I received the land valuation notice on our Wellington Point block and it had risen from $350,000 to $420,000! I will certainly be asking for an explanation as to why such a huge increase – $70,000 from 2015. I don’t do percentages, I will leave that to the experts!